Getting a handle on retirement
- artlembo
- Mar 31
- 7 min read
Updated: Apr 7
This will be the first of two blog posts related to retirement and investment. This post will focus on people approaching retirement age, and how secure they may be in a retirement that might be around the corner. The next post will be targeted toward young professionals entering the job marketing and thinking about how to invest for the future. So, if you like this post, tell your children to check out the next one!
Now, most of my blog posts are about geographical information science, so what makes me an expert on retirement and investment? Nothing, actually. But, as a quantitative geographer, I am pretty good with numbers and programming. And, as I get older, I am giving more thought about when to retire.
As I began thinking about retirement and working with my financial advisor(s), I wanted to get a feel for things on my own. You may have heard something like over the lifetime of the S&P 500, it earns around 9% a year. So, you might think, I've got X dollars in my investment accounts, and I plan to retire in 10 years. So, simply multiply my investments by 9% for the next 10 years, right?
Historical Performance of the S&P 500
That's not how it works, and most people know that. Each year impacts other years. As this chart shows, the S&P 500 fluctuates all the time based on the current economy, political uncertainties, wars, and other conflicts.

We can certainly see the impact of the Great Depression, the DotCom boom (and bubble), and the financial housing collapse. In the case of the Great Depression, if you tried to retire in 1930, you wouldn't see 9% growth for a good decade! Similarly, in the mid-1990's we saw massive growth beyond 9%. Therefore, when thinking about retirement it is useful to look at a range of possibilities based on when you would retire.
To better understand the different permutations, I created a small javascript program to mimic the yearly returns of the S&P 500, and then used that program imagine what investments would look like if trying to retire at any point over the last 100 years. Of course we can't predict the future, but this is a nice way to see how historical trends can impact one's investment.
The Basic Program
You can find my rather unpolished website I created here that uses my program. Let's step through an example to see how it works.

Referring to the figure above, the program allows you to see yearly returns for a given start date (i.e. 1941), an initial investment (i.e. $1,730,000), the amount you want to withdraw (i.e. $80,000), and a horizon for how long you might want to continue withdrawing from your investments (i.e. 30 years). If you press the Calculate Using Dollars button, you'll see the result of how the market behaved from 1941 - 1971:

Example: Results From Individual Years
Wow. Needless to say, 1941 would have been a good year to retire!!! Sure, the first year you would have lost 11%, but look at the next 4 years with increases of 19% to 36%. You'll notice that by 1966 (when you are 25 years older), you'd have $29,799,548 in your portfolio - yep, you'd be living large.
But, what if you retired in 1929?

Uh oh. You got pounded in 1929, 1930, 1931, and 1932. Things picked up again in 1933, but in 1937 you got hammered again. If you continued to take out $80,000 a year, you'd run out of money by 1943 - so sad, 14 years after retirement and you're broke!!!
Now, of course nobody would keep taking out $80,000 a year. You'd have to adjust your lifestyle to try and make ends meet. But the point here is this: a catastrophic event like the Great Depression and then a double whammy in 1937 would wreak havoc on your ability to retire. Fortunately, we don't have too many Great Depressions.
Evaluating Your Portfolio Over Many Different Scenarios
So the next question is, what would my returns look like for every year. To compute that, you'd press the Calculate Every Year Using Increased Withdrawal button. What this button does is allow you to run that same scenario, but instead of looking at a single year like 1941 or 1929, it looks at all years.

.
.
.

In this scenario, I decided to increase my withdrawal by 2.5% each year to keep up with inflation. So, I start withdrawing $80,000, but after 30 years I'd be withdrawing $167,805 (because each year I take out 2.5% more). You can see from the table that if you retired between 1928 and 1930, you run out of money - again, the impact of the Great Depression. But even if you retired in 1931, you'd be able to survive and have $1,093,688 remaining after 30 years. And, looking at 1996 (just 5 years before 9/11, and 12 years before the housing collapse), you'd still be doing quite well - meaning you'd weather the dotcom bubble collapse, 9/11, and the housing collapse. What really causes your retirement plans to fail is not one, two, or three bad years in a row, but having those three bad years, and then a few years later getting hit with another bad year. Looking at the table above, you can see how your investments would have done after 30 years when starting at any number of beginning years.
Changing the Time Horizon
The $NaN value means not a number - 30 years after 1997 puts us beyond today's date, so we can't calculate the value. If you want to see how you'd do if retiring in 2000 where you get hit by 9/11 and the housing collapse, simply change your horizon to 25 years. So, you can't see what it looks like after 30 years because I'm writing this blog post in 2026.

Changing Up the Variables
You'll notice under this scenario that if you retired in 2000, you'd run out of money. But, if you retired in 2001, you'd be able to get through those financial downturns. What a difference a year makes. So what was the problem with retiring in 2001? It turns out, just like the Great Depression, we were hit with the dotcom bubble, 9/11, and then a few years later, the financial housing crises - three whammy's in 8 years. It's just really hard to bounce back from something like that. But, instead of having $1.7M, see what happens if you have $1.8M, or see what happens when you only withdraw $60,000 a year - that start year of 2000 now has $2.1M left after 25 years if you only take out $60,000 a year. The beauty of this program is you can start to play around with all the different variables like your starting amount, withdrawal, inflation adjustment, and number of years on the horizon.
Results from Multiple Outcomes
Finally, the table includes another important feature: I show the interdecile range for the historical returns.
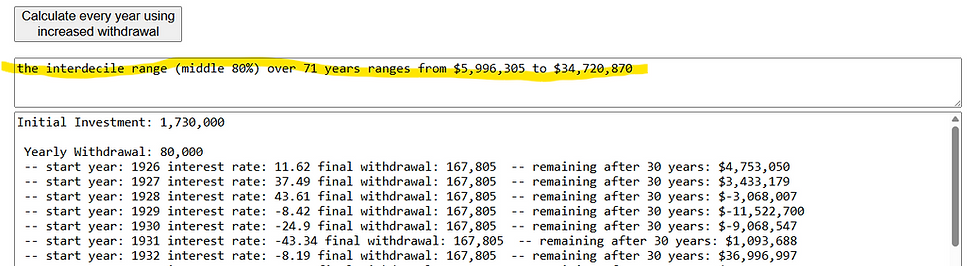
In this case, we're running the model under every scenario for a retirement start date, and looking at how much money is remaining after the specified number of years. Rather than showing the highest and lowest results, I'm presenting the middle 80% (throwing out the top and bottom 10 percent years). In our example, it shows you'd have between $5.9M and $34.7M after 30 years. A very comfortable retirement, indeed. Once again, play around with the numbers and see what happens if you withdraw $100,000 instead of $80,000. Or have $1.6M instead of $1.8M.
How to Evaluate the Results for Yourself
Now, keeping with our example, if you are approaching retirement and have $1.74M in investments that mimic the S&P 500, I'd say you have an excellent chance of meeting your retirement goals of taking out $80,000 a year and increasing your withdrawals by 2.5% (your interdecile range shows you'd have between $5.9M to $34M in remaining funds after 30 years).
To take this a little bit further, let's assume your Social Security payment is around $50,000 (if it's you and a spouse), that means you'd be withdrawing $130,000 to begin with ($80,000 from your investment and $50,000 from Social Security), and be taking out well over $200,000 a year by the time you are 90 years old. Of course, with a good financial advisor, you'll be able to make some adjustments along the way, and potentially blend your investments into different strategies. But the point is, this is a good way to assess how well you are positioned for retirement.
Now It's Your Turn
So, go ahead and play with the numbers. Don't have $1.73M? No problem, put in what you have and see where things might wind up in 30 years. Also, show this to your financial advisor to get their opinion. The financial advisors I've spoken with all indicate this is a very good estimate of what retirement could look like given your current investments, and they can help refine your plan going forward.
In my next post, I'll focus on the twenty-something who is starting their career, and maybe putting in $4,000 a year to start, and then slowly increasing it. What we'll want to know is how much that person will have invested by the time they are 62 years old. Spoiler alert: they'll have millions!!! Get your kids to read this next post.


Really interesting concepts. Along with the Monte Carlo simulations, it helps provide a sense of comfort (or not)